
How simple visual thinking techniques can turn ordinary flip charts into tools for better meetings, workshops and learning.
I recently received a registration for one of my upcoming bikablo training sessions from an experienced facilitator who was looking forward to developing a new skill. She admitted that she'd often admired the beautiful flip charts other facilitators created but had always assumed she couldn't do the same because she wasn't artistic.
I suspect she's not alone.
If you've ever watched someone turn a blank sheet of flip-chart paper into a colourful, engaging visual and thought, "I wish I could do that," I have some good news. You probably can. And you don't need to be an artist to get started.
I've been on that learning journey myself. When I first started exploring visual thinking, I spent a lot of time practising lettering, drawing simple figures, experimenting with containers and trying to figure out how to arrange information on a page. Some of my early efforts were considerably more successful than others!
Over time, however, I discovered that the real value of a good flip chart has very little to do with artistic ability. It's about communicating ideas, making information easier to understand and giving people something they can engage with.
And once you start thinking about flip charts that way, the possibilities go well beyond recording a few bullet points during a meeting.
A flip chart can start working before you do
Think about the experience of walking into a meeting or workshop. There are chairs, perhaps a projector, some coffee and, if you're lucky, a few biscuits. Everyone finds a seat and waits for something to happen.
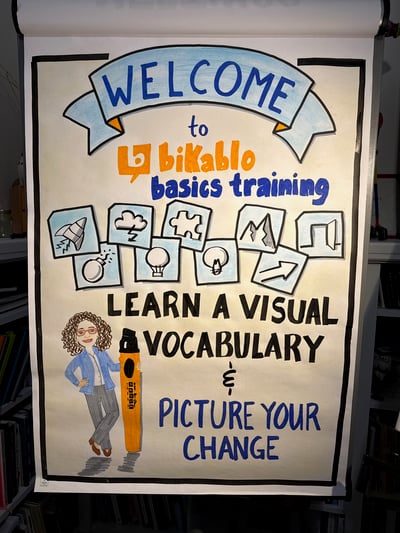
Now imagine entering that same room and being greeted by a colourful, hand-drawn welcome chart.
It might include the name of the workshop, a few simple illustrations, an inviting message or even a question to get people thinking. Before anyone has said a word, you've already communicated something about the experience people are about to have.
I've created welcome posters for my bikablo training sessions, and I love how they help transform an ordinary training room into a space that feels intentional and inviting.
A welcome chart doesn't need to be elaborate. A strong title, a few well-chosen colours and some simple visual elements can make a significant difference. You're not trying to create a work of art. You're setting the tone for what comes next.
Make the journey visible
Most meetings and workshops have an agenda, but that doesn't mean participants have a clear picture of where they're going.
A visual agenda can do more than tell people what's happening at 10 a.m. or when lunch is scheduled. It can show the progression of a day, highlight important milestones and help participants understand how the different activities fit together.
You might use a simple pathway, a series of containers, numbered stages or a visual metaphor that reflects the purpose of the session.
As the day progresses, you can return to the chart, mark what you've accomplished and help participants see where they are in the overall journey.
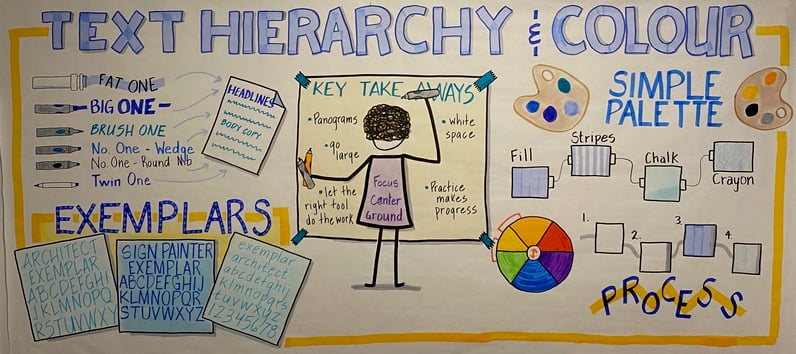
This is where some of the techniques I learned through bikablo become especially useful. Containers, arrows, banners, simple icons and lettering styles can all help organize information without making the page overly complicated.
The trick is to start with the purpose of the chart. What do people need to understand? What should stand out? Where do you want their eyes to go first?
Once you've answered those questions, the visual design becomes much easier.
Help people understand complicated ideas
This is one of my favourite applications of visual thinking, particularly given my background in marketing and business consulting.
I've spent years helping organizations understand concepts such as customer journeys, sales processes, inbound marketing and CRM systems. These topics can get complicated quickly, especially when everyone brings a slightly different understanding to the conversation.
A good visual can help make the relationships between ideas much clearer.
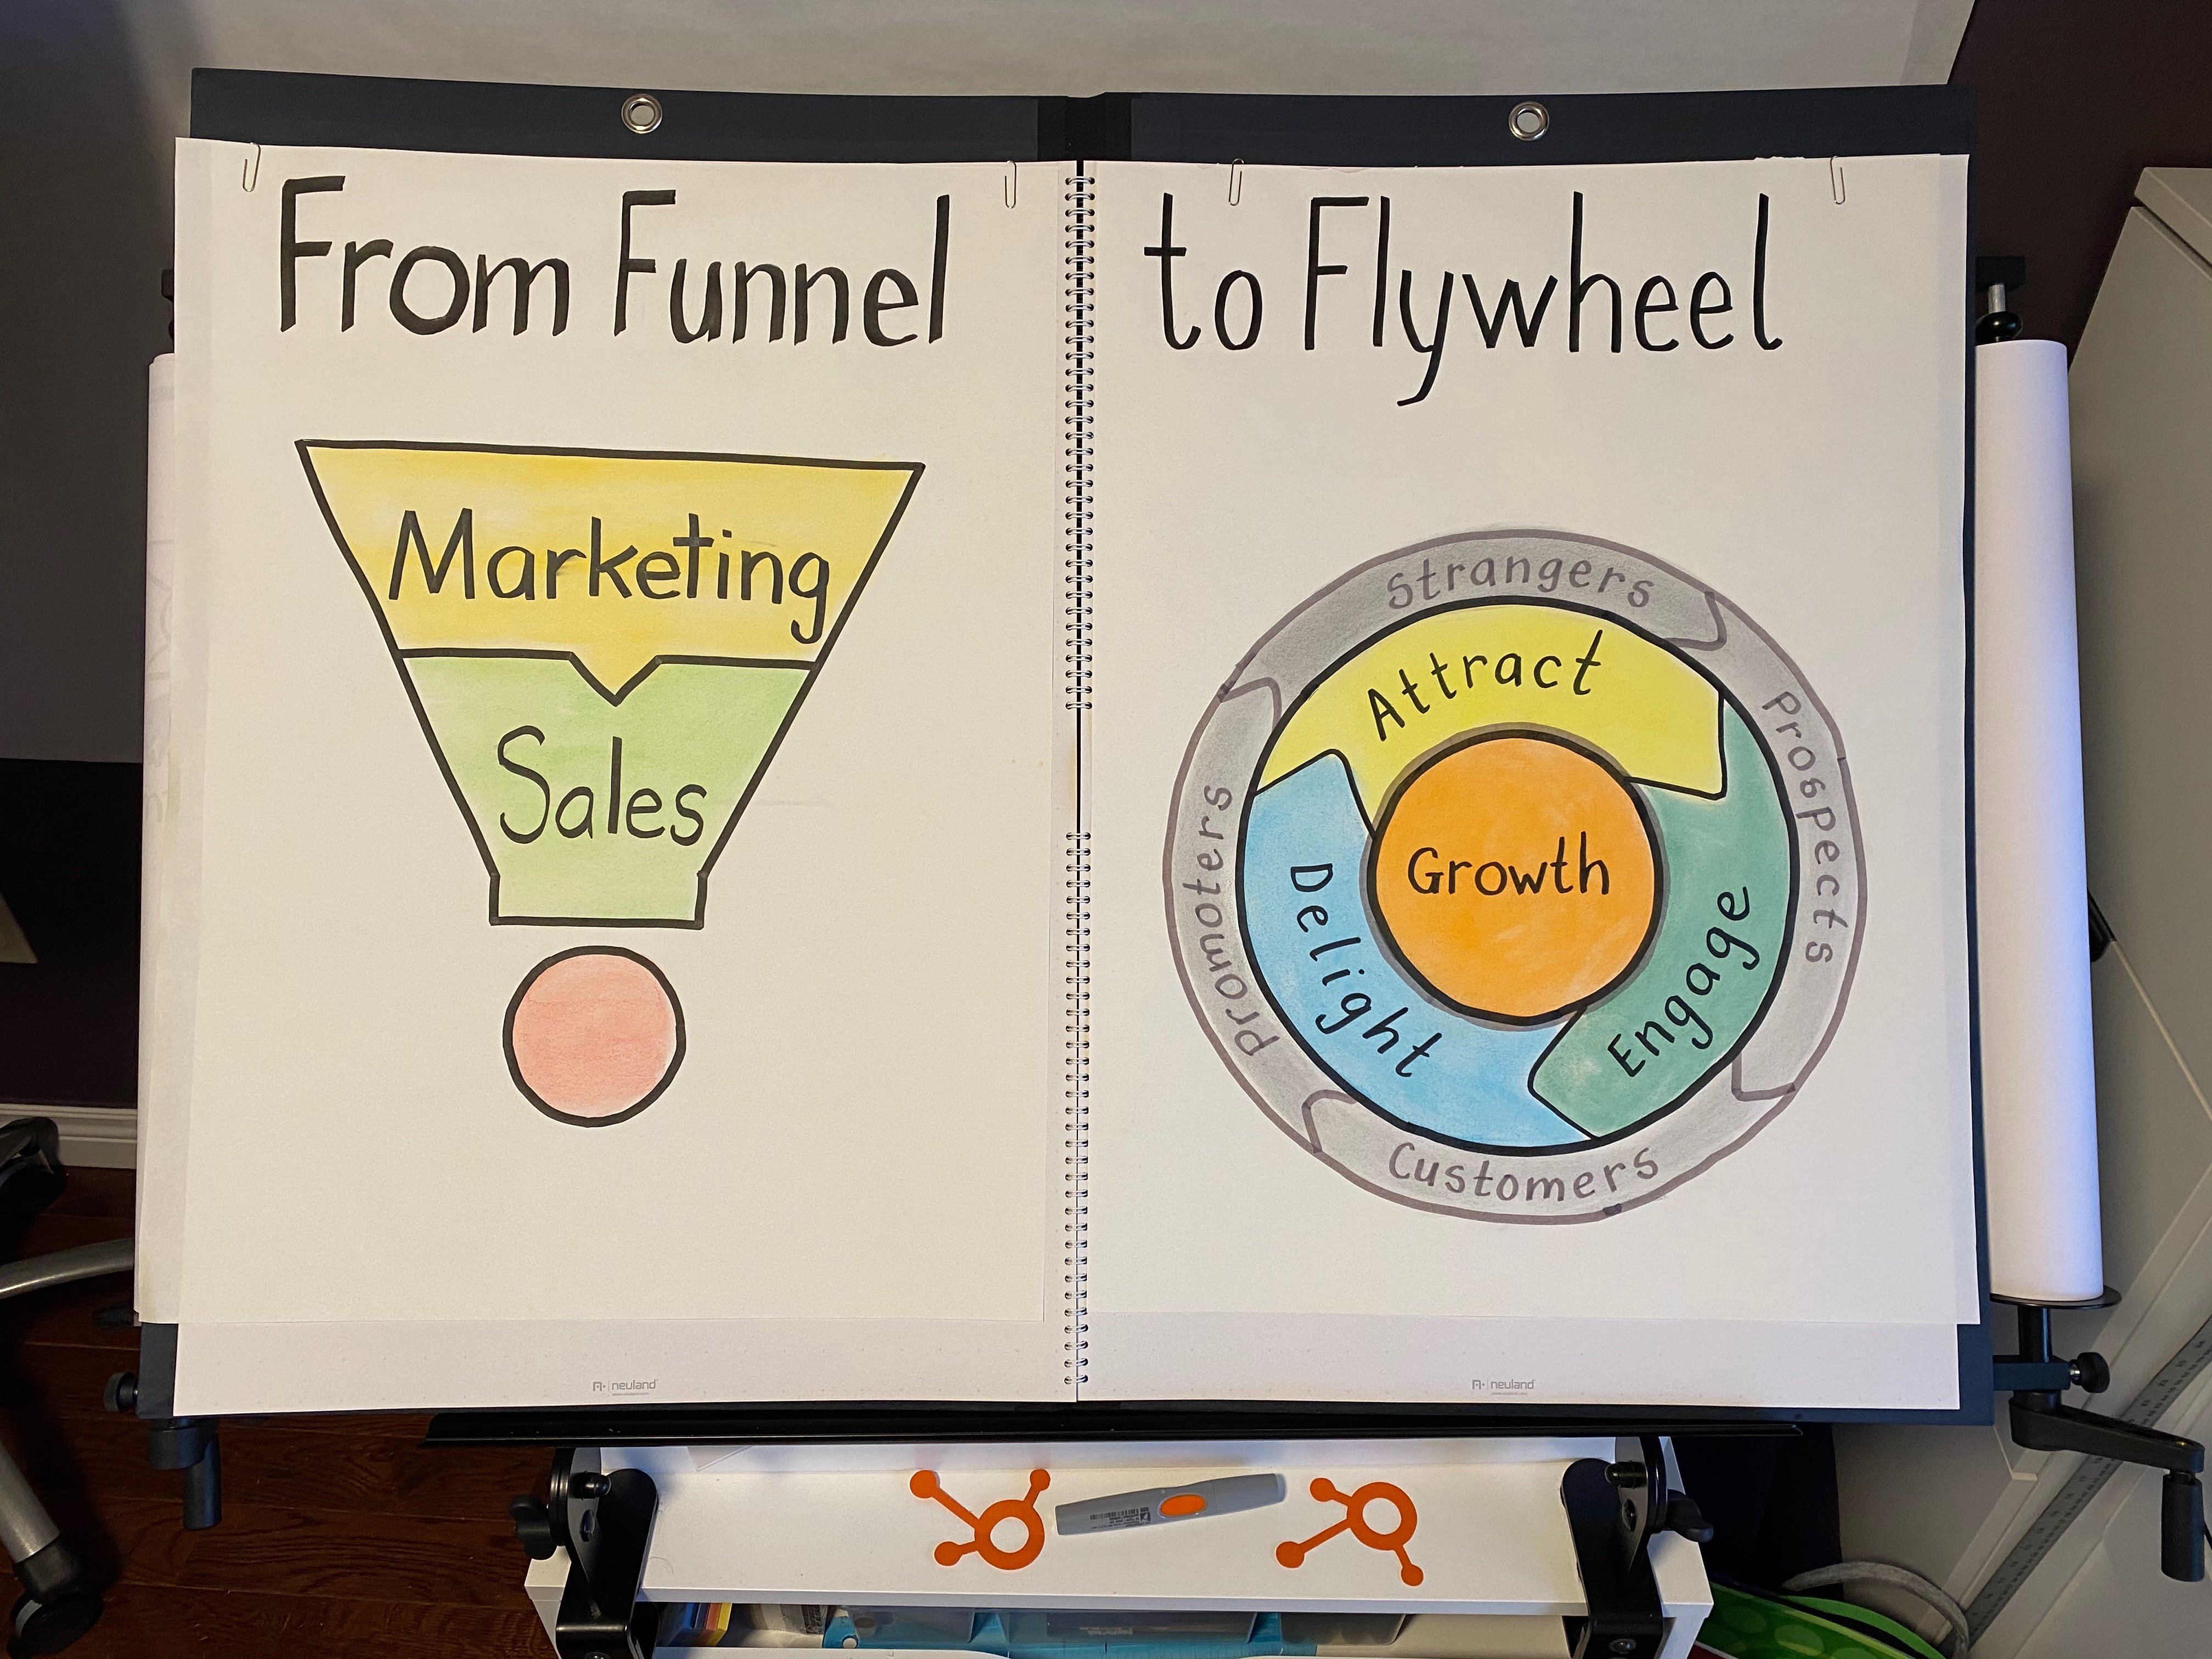
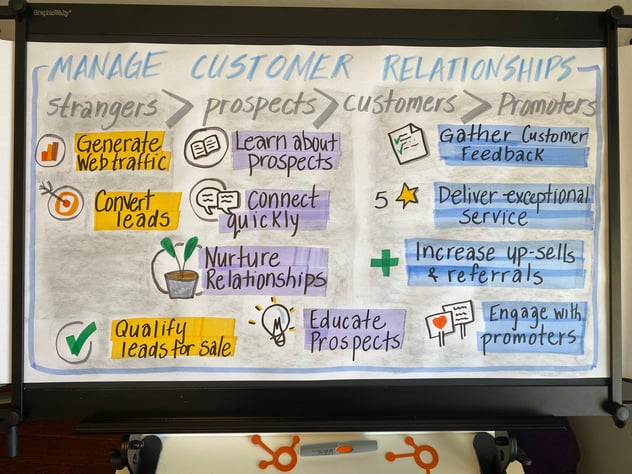
For example, I've created charts illustrating customer conversion paths, the progression from strangers to customers and promoters, and the shift from a traditional sales funnel to the customer-focused flywheel model.
What I like about these examples is that they're not particularly complicated drawings. Their strength comes from the way the information is organized.
Arrows show progression. Colours distinguish stages. Simple icons reinforce important concepts. The layout helps people understand how the pieces fit together.
In some cases, a visual can communicate a relationship much faster than a paragraph of explanation.
Of course, not every concept needs an illustration. Sometimes a clear title and a few well-organized words are exactly what's required. The skill is knowing when a visual element will help people understand something and when it will simply add clutter.
Give people a place to contribute
This is where flip charts become particularly interesting to me.
A flip chart doesn't have to be a finished product that you unveil to your audience. It can be something you build together.
Imagine you're facilitating a discussion about a team's biggest challenges. Rather than simply writing everyone's comments in a long list, you might prepare a chart with three containers: What's Working, What's Getting in the Way and What Could We Try?
As participants contribute, their ideas have somewhere to go. Patterns begin to emerge. Connections become easier to see, and the group has a shared picture of the conversation as it develops.
You can do something similar with questions, priorities, action plans, decision-making frameworks or even a simple parking lot for ideas that deserve attention later.
The visual structure helps guide the conversation without dictating the answers.
It's a subtle but important distinction. You're no longer just recording what people say. You're helping them think together.
And you certainly don't need elaborate drawings to accomplish that. A few simple containers, some clear lettering and thoughtful use of space can be remarkably effective.
Capture the learning, not just the notes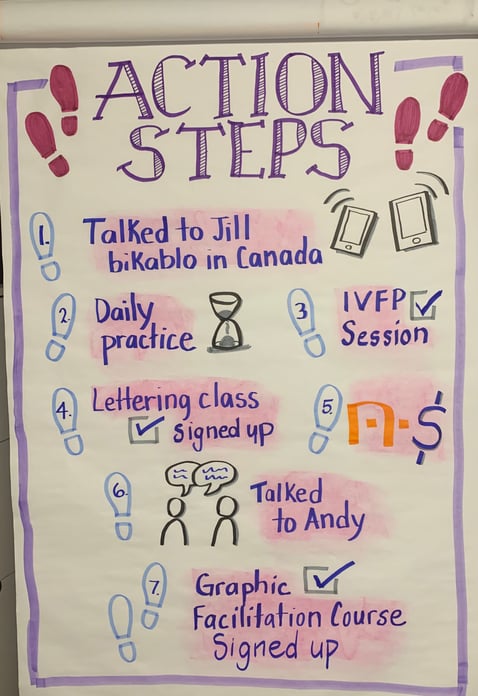
Have you ever attended a really good workshop, left feeling inspired and then struggled to remember the details a week later?
I certainly have.
One of the things I enjoy about visual thinking is the opportunity to capture what matters from an experience in a way that's meaningful to you.
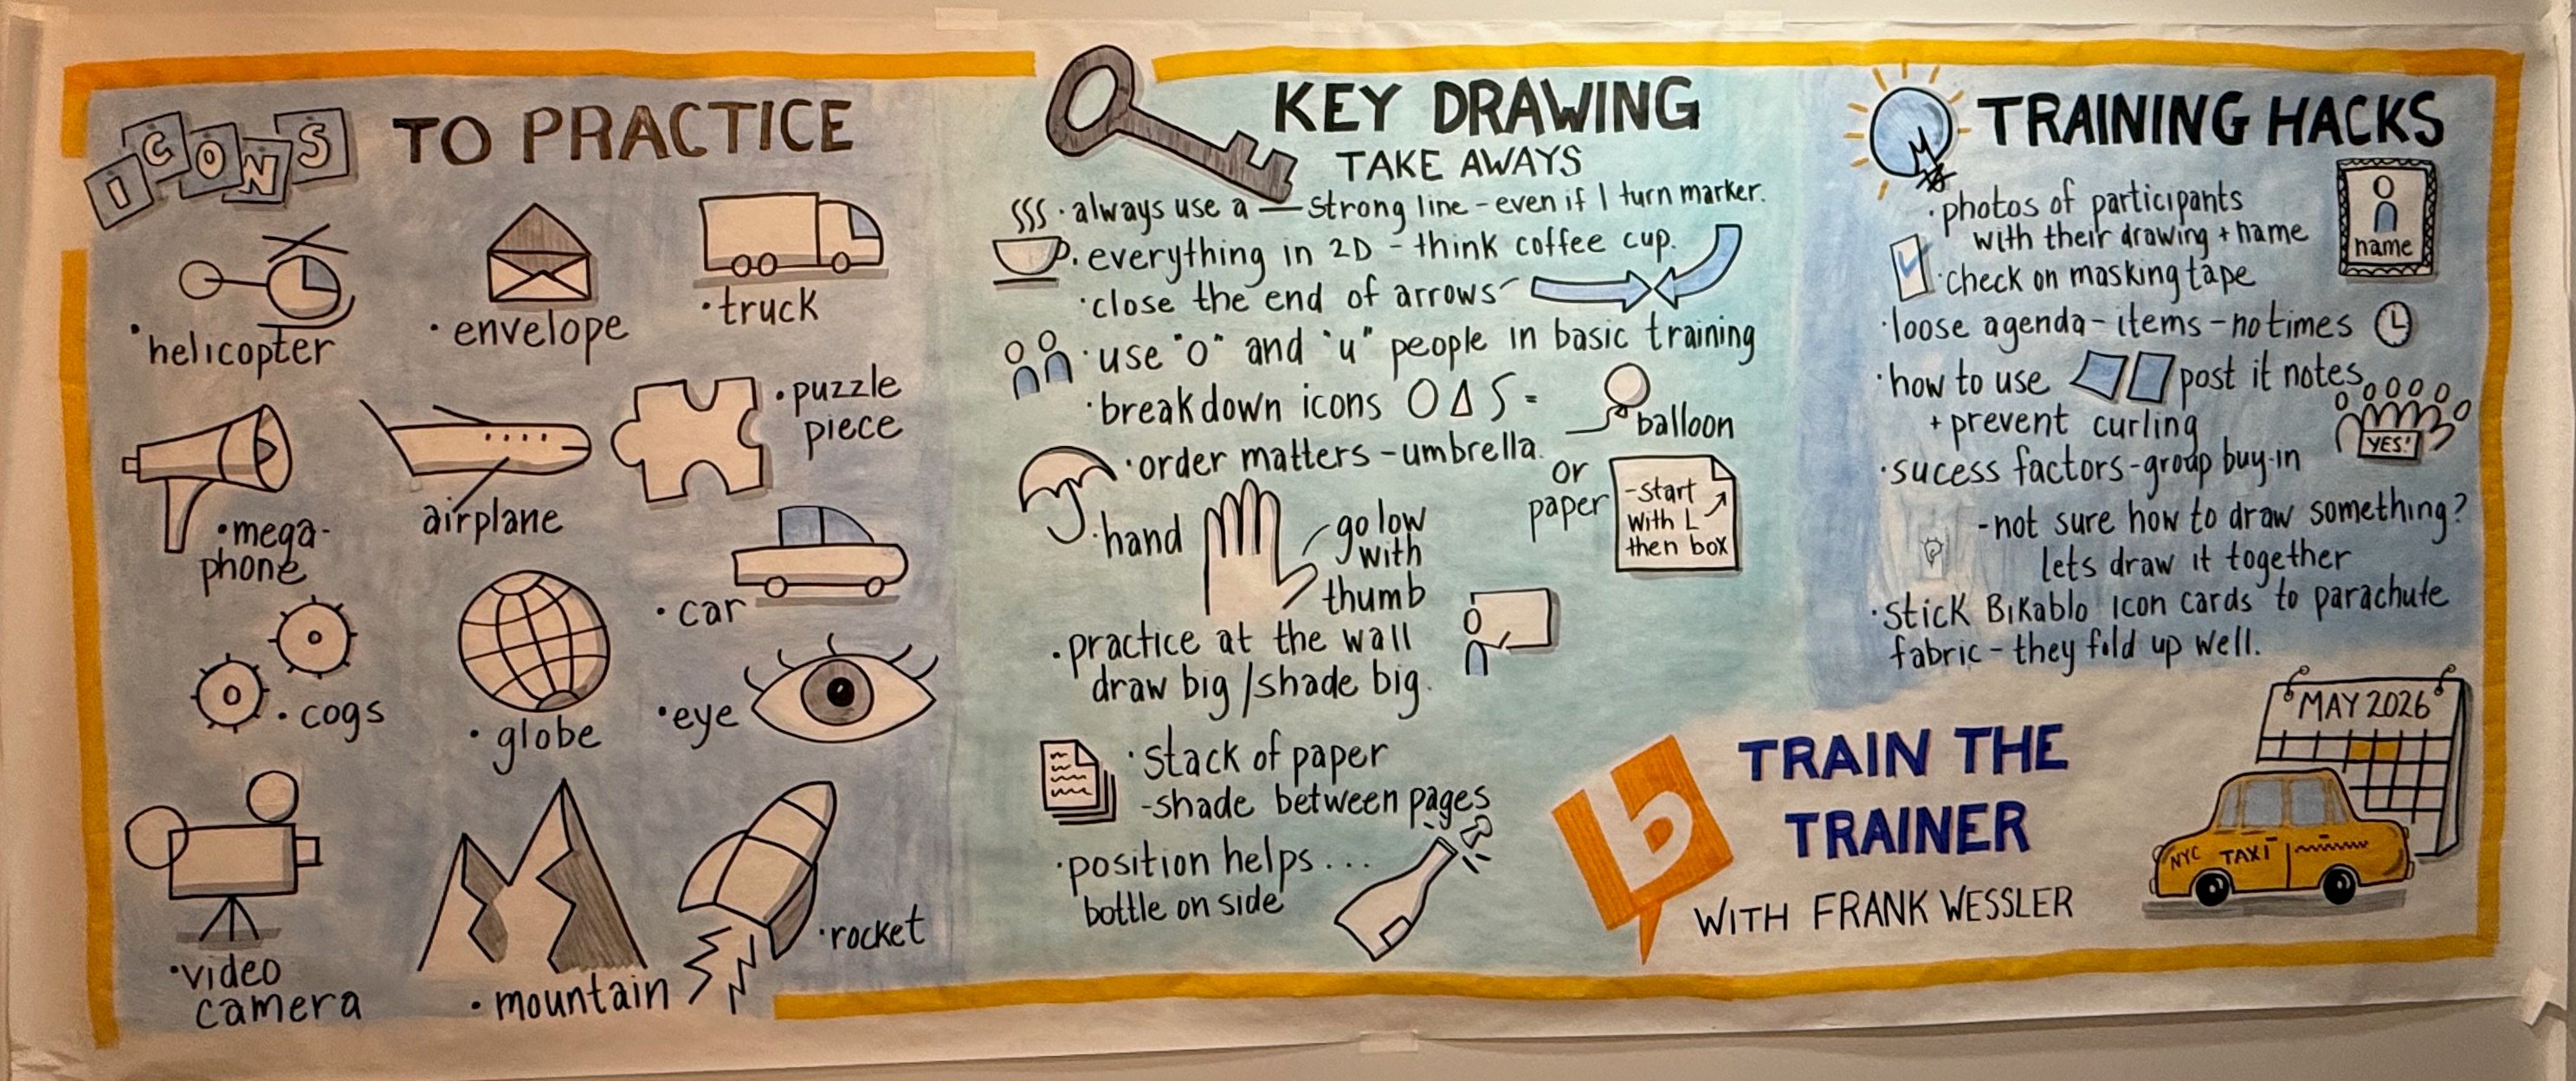
After completing my bikablo Train-the-Trainer course in New York in May, I created a large-format visual reflection of the experience. It wasn't graphic recording that I produced during the course. I drew it afterward, as a way of processing what I'd learned and identifying the ideas I wanted to carry forward.
The process of deciding what to include, how to represent it and how the different ideas connected was itself a valuable learning exercise.
I've done similar things with other training experiences, and I find that creating a visual reflection encourages me to think more deeply about what stood out and why.
For facilitators and educators, this opens up some interesting possibilities. A visual recap can help participants revisit key ideas, reflect on what they've learned and identify how they might apply it.
It can also become something participants contribute to themselves.
Five small changes that can make a big difference
If you're looking at your own flip charts and wondering where to start, you don't need to transform everything overnight.
Here are five things worth experimenting with.
1. Give your chart a proper title. A strong, easy-to-read heading immediately tells people what they're looking at. Try using larger lettering, a simple banner or a different weight of marker to make it stand out.
2. Put related information into containers. Boxes, circles, speech bubbles and other simple shapes can help organize information and create visual hierarchy. You don't need to draw anything complicated to make a page easier to follow.
3. Build a small visual vocabulary. Start with a handful of useful icons: a light bulb for ideas, a target for goals, a clock for time, a speech bubble for conversation and a simple person figure. Once you're comfortable drawing them, you'll find yourself using them everywhere.
4. Use colour with intention. Colour can highlight important information, distinguish categories or guide attention. It doesn't have to fill every available space. In fact, a limited palette often works better than using every marker in the box.
5. Leave room to breathe. It's tempting to fill every inch of flip-chart paper, particularly when you're capturing ideas during a lively discussion. But white space is part of the design. It helps people distinguish between ideas and makes the overall chart easier to read.
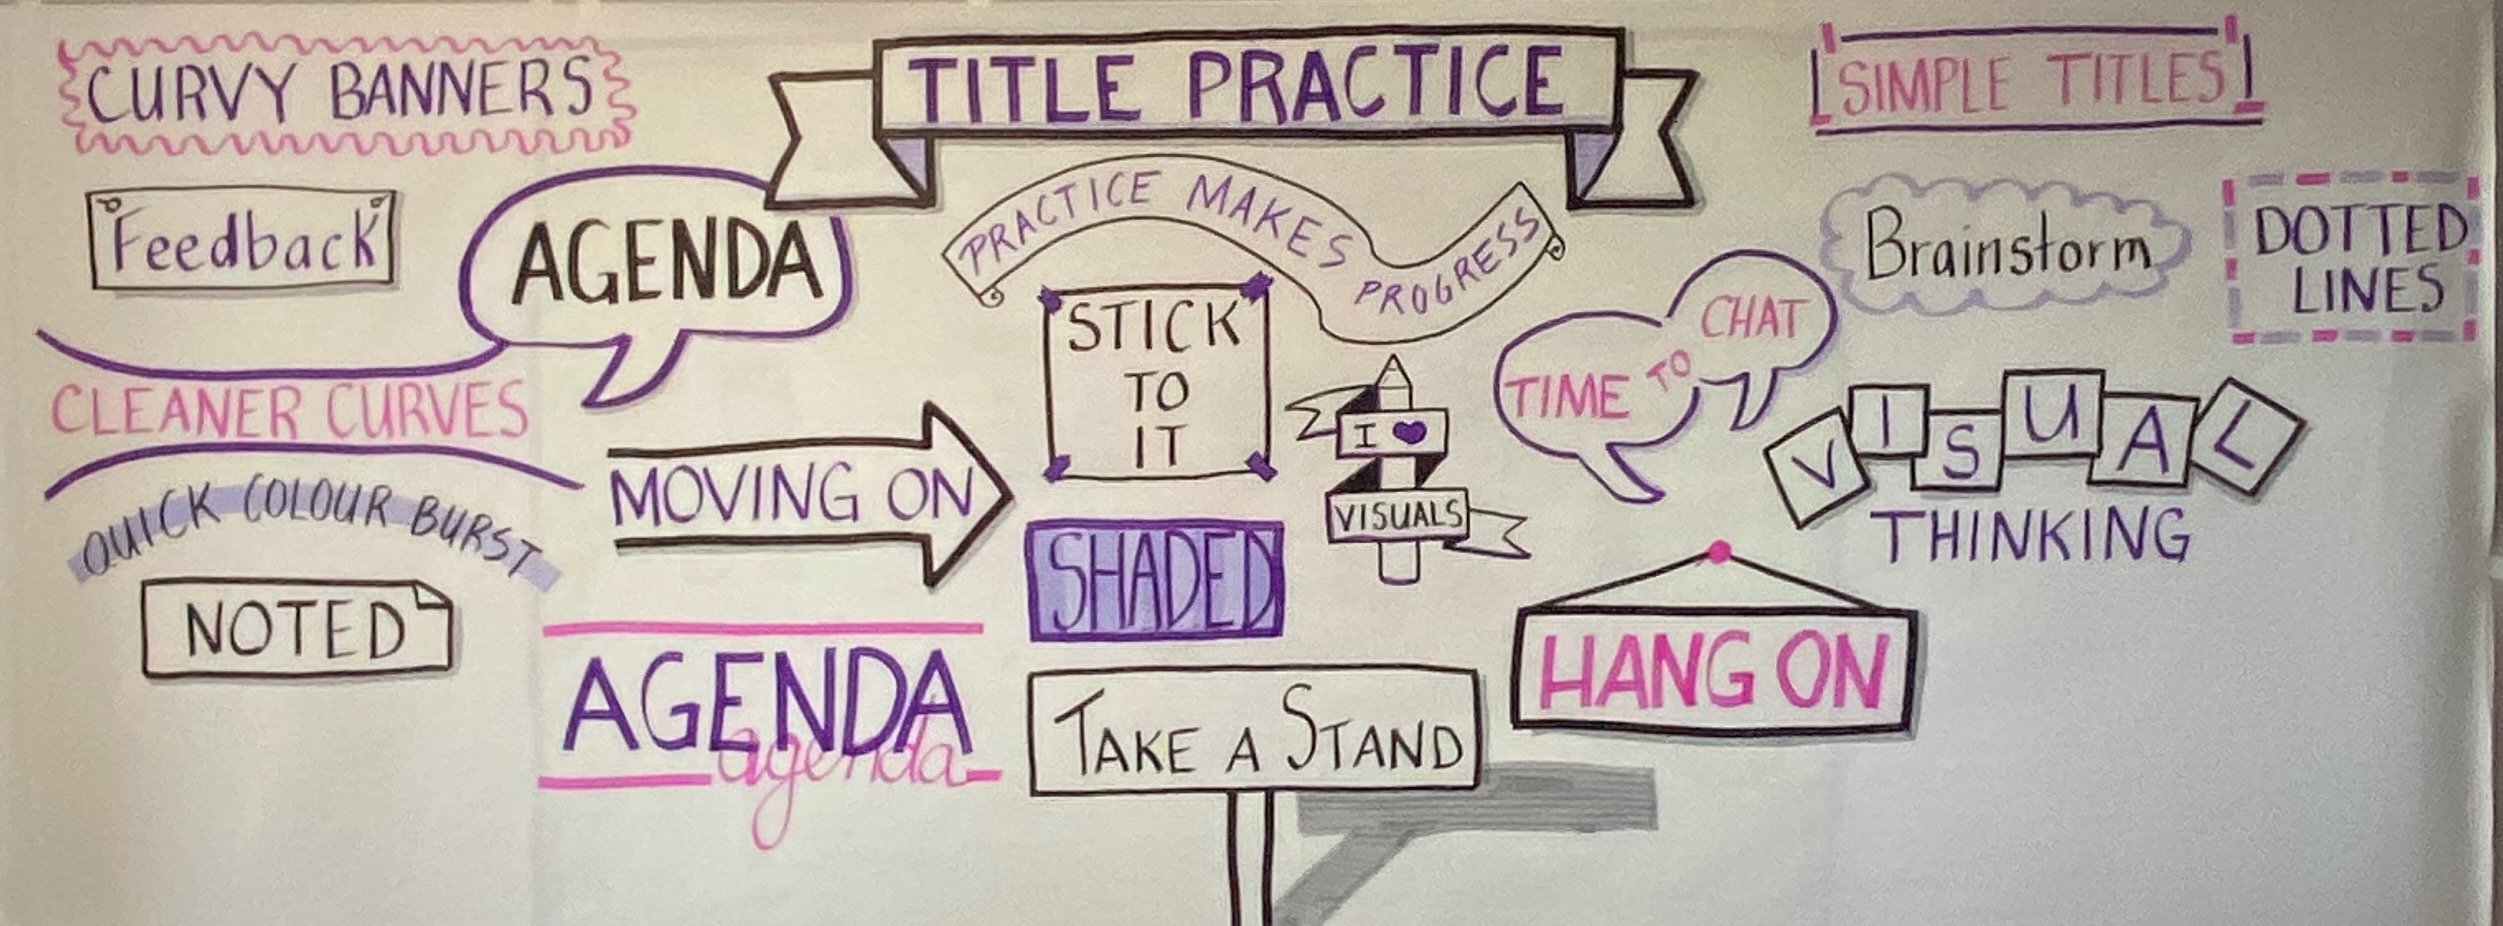
None of these techniques requires you to be particularly artistic. They require a little practice and a willingness to experiment.
And that's really the point.
You don't have to be an artist. You just have to start.
When I look back at some of my earliest flip charts, I can see how much experimenting I was doing. I was learning how to form letters, combine shapes, create shadows and work with colour. I was also learning something more important: how to decide what information needed to be visible and how to arrange it so other people could make sense of it.
Those early charts don't look quite like the ones I create today, and that's a good thing. Skills develop through practice.
One of the things I particularly appreciate about the bikablo approach is that it gives people a visual vocabulary they can learn and apply. You're not expected to arrive knowing how to draw. You learn techniques that make visual communication accessible and repeatable.
You also begin to see opportunities to use those skills in places you might never have considered before. A welcome poster, a meeting agenda, a process map, a workshop recap or a planning session can all benefit from a little visual thinking.
And perhaps that's the biggest shift of all.
The goal isn't to make your flip charts prettier, although that can certainly be a happy outcome. It's to make them more useful.
When a chart helps someone understand an idea, contribute to a conversation, remember something important or see a way forward, it's doing its job.
So, if you've been admiring other people's flip charts from the sidelines, perhaps it's time to pick up a marker and give it a try.
You might surprise yourself.
Ready to up your flip chart game?
If you'd like to build your confidence and develop practical visual communication skills, I'll be offering bikablo training in Halifax on February 10–11 and Toronto on February 17–18, 2027.
These two-day, hands-on workshops introduce the visual vocabulary and techniques you can use in meetings, facilitation, training, presentations and everyday work.
No drawing experience required. Just curiosity and a willingness to give it a go.
Learn more about bikablo training in Canada